Pine Script (TradingView)
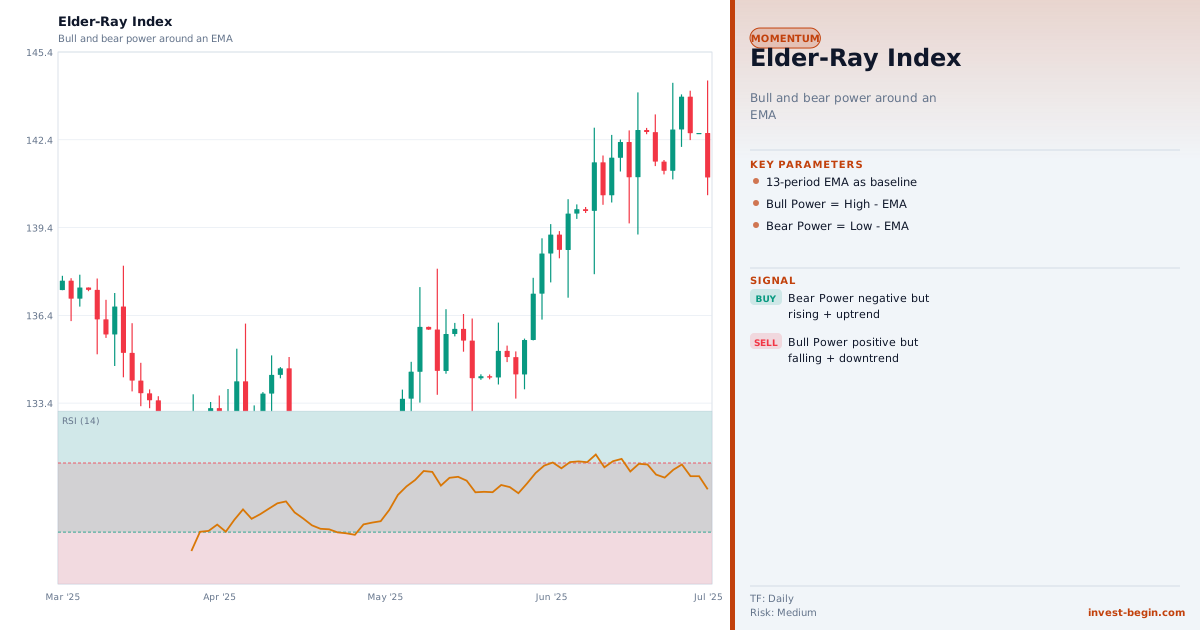
Ceci est un exemple Pine Script TradingView pour cet indicateur. Collez-le dans l'editeur Pine TradingView, ajoutez-le au graphique, puis ajustez les parametres selon votre marche et votre unite de temps.
//@version=6
indicator("Elder Ray Index (Bull & Bear Power)", overlay=false)
length    = input.int(13, "EMA Length")
emaVal    = ta.ema(close, length)
bullPower = high - emaVal
bearPower = low  - emaVal
longSignal  = bullPower > 0 and bearPower > bearPower[1] and emaVal > emaVal[1]
shortSignal = bearPower < 0 and bullPower < bullPower[1] and emaVal < emaVal[1]
plotshape(longSignal,  style=shape.triangleup,   location=location.bottom, color=color.green, size=size.small)
plotshape(shortSignal, style=shape.triangledown, location=location.top,    color=color.red,   size=size.small)
hline(0, "Zero", color=color.gray, linestyle=hline.style_dotted)
plothistogram(bullPower, "Bull Power", color=color.new(color.green, 0))
plothistogram(bearPower, "Bear Power", color=color.new(color.red,   0))