← Back to Home
Trading Strategy
🐚

Fibonacci Retracement Strategy

Use mathematical ratios to identify high-probability pull-back entries.

Start Automating Free β†’

Want to automate this strategy? Try auto-Trading free β€” no credit card required.

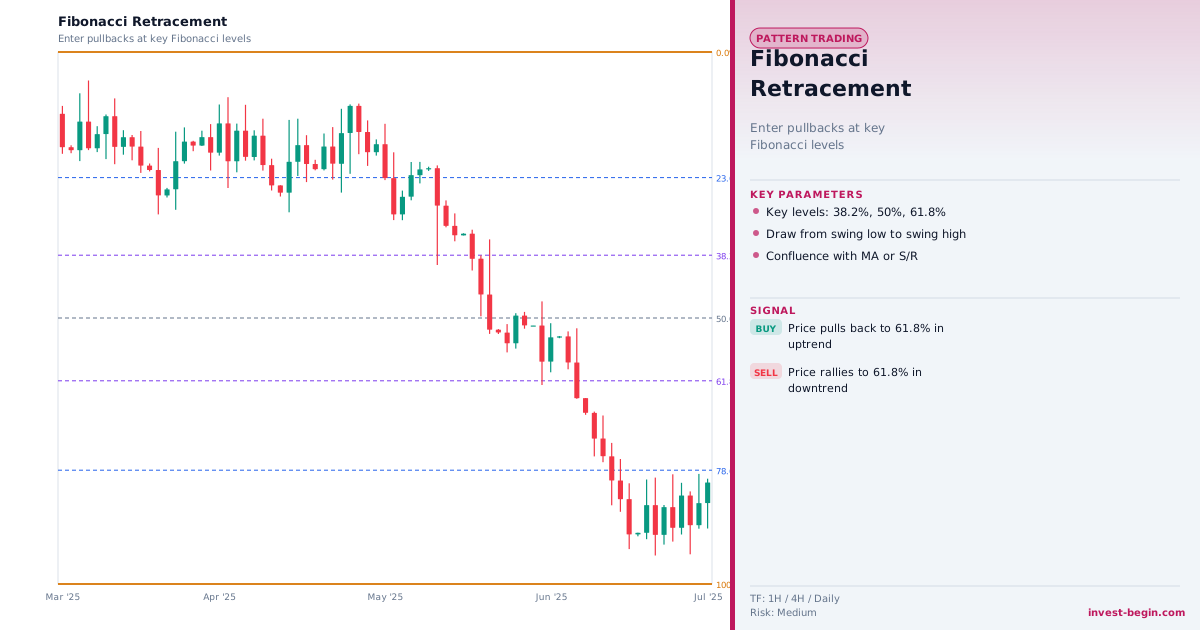
Fibonacci Retracement Strategy chart

Overview

What is Fibonacci Retracement Strategy?

Fibonacci retracement is a technical analysis tool based on the mathematical ratios derived from the Fibonacci sequence: 23.6%, 38.2%, 50%, 61.8%, and 78.6%. Traders draw retracement levels between a significant swing high and swing low (or vice versa) and use these levels to anticipate where a pull-back might find support or resistance before the trend resumes.

The rationale is partly mathematical and partly self-fulfilling: because so many traders and algorithmic systems use these levels, they tend to act as coordination points where buy and sell decisions cluster. The 61.8% level β€” the "golden ratio" β€” is particularly significant and often marks the deepest pull-back that still preserves the trend structure.

A typical long setup involves: identifying a clear uptrend, waiting for a pull-back, drawing Fibonacci levels from the swing low to the swing high, and placing a limit buy order at the 50% or 61.8% level with a stop below the 78.6% level. Confluence with other indicators (RSI oversold, a key horizontal support, an order block) increases the probability of success.

Fibonacci extensions are used to project profit targets beyond the swing high, with the 127.2%, 161.8%, and 261.8% levels serving as common take-profit zones.

How It Works in auto-Trading

Automate It

auto-Trading automatically identifies swing highs and lows using a configurable zig-zag algorithm, then calculates Fibonacci retracement and extension levels for each significant swing. When price pulls back to a major Fib level and a momentum confirmation signal fires, a limit entry order is placed at that level with the stop and target pre-calculated.

Try Free β†’

Strategy Code

Pick a script below, copy it, and use it on your chart.

Pine Script (TradingView)

This is a TradingView Pine Script strategy example for this page concept. Paste it into the TradingView Pine Editor, add it to your chart, and run it in the Strategy Tester.

//@version=6
strategy("Fibonacci Retracement Strategy", overlay=true)
emaFast = ta.ema(close, 20)
emaSlow = ta.ema(close, 50)
bullStructure = close > emaFast and emaFast > emaSlow
bearStructure = close < emaFast and emaFast < emaSlow
liquidityGrab = low < ta.lowest(low, 10)[1] and close > open
longSignal = bullStructure and liquidityGrab
exitSignal = bearStructure
if longSignal
    strategy.entry("Long", strategy.long)
if exitSignal
    strategy.close("Long")
plot(emaFast, "Fast", color=color.aqua)
plot(emaSlow, "Slow", color=color.orange)

ThinkScript (thinkorswim)

This is a thinkorswim ThinkScript strategy example for this page concept. Open thinkorswim, create a custom strategy, paste the script, and apply it to your chart.

def fast = ExpAverage(close, 20);
def slow = ExpAverage(close, 50);
def liquidityGrab = low < Lowest(low, 10)[1] and close > open;
def buySignal = close > fast and fast > slow and liquidityGrab;
def sellSignal = close < fast;
AddOrder(OrderType.BUY_AUTO, buySignal, close, 1, Color.GREEN, Color.GREEN, "SMC Buy");
AddOrder(OrderType.SELL_AUTO, sellSignal, close, 1, Color.RED, Color.RED, "SMC Exit");
plot FastLine = fast;
FastLine.SetDefaultColor(Color.CYAN);
plot SlowLine = slow;
SlowLine.SetDefaultColor(Color.ORANGE);

Ready to automate Fibonacci Retracement Strategy?

Join thousands of traders who use auto-Trading to execute this strategy automatically, 24/7.

Get Started Free β†’

All Strategies & Signals

Continue Learning

Trading Strategies

Trading Signals & Indicators